Real Madrid Legacy Insights
A Power BI dashboard that walks through Real Madrid's history and turns it into a working performance analysis tool.
What it solves
- Four independent views, each answering a different question without forcing the user to switch reports.
- Star schema with reusable DAX measures for win ratios, goals and titles per season.
- Player comparisons on a shared timeline, so individual contribution reads against team performance.
A club with more than a century of history produces a volume of data that rarely gets looked at as a whole. This project takes that scattered history and organises it into a single dashboard where every question has its own view.
The four views
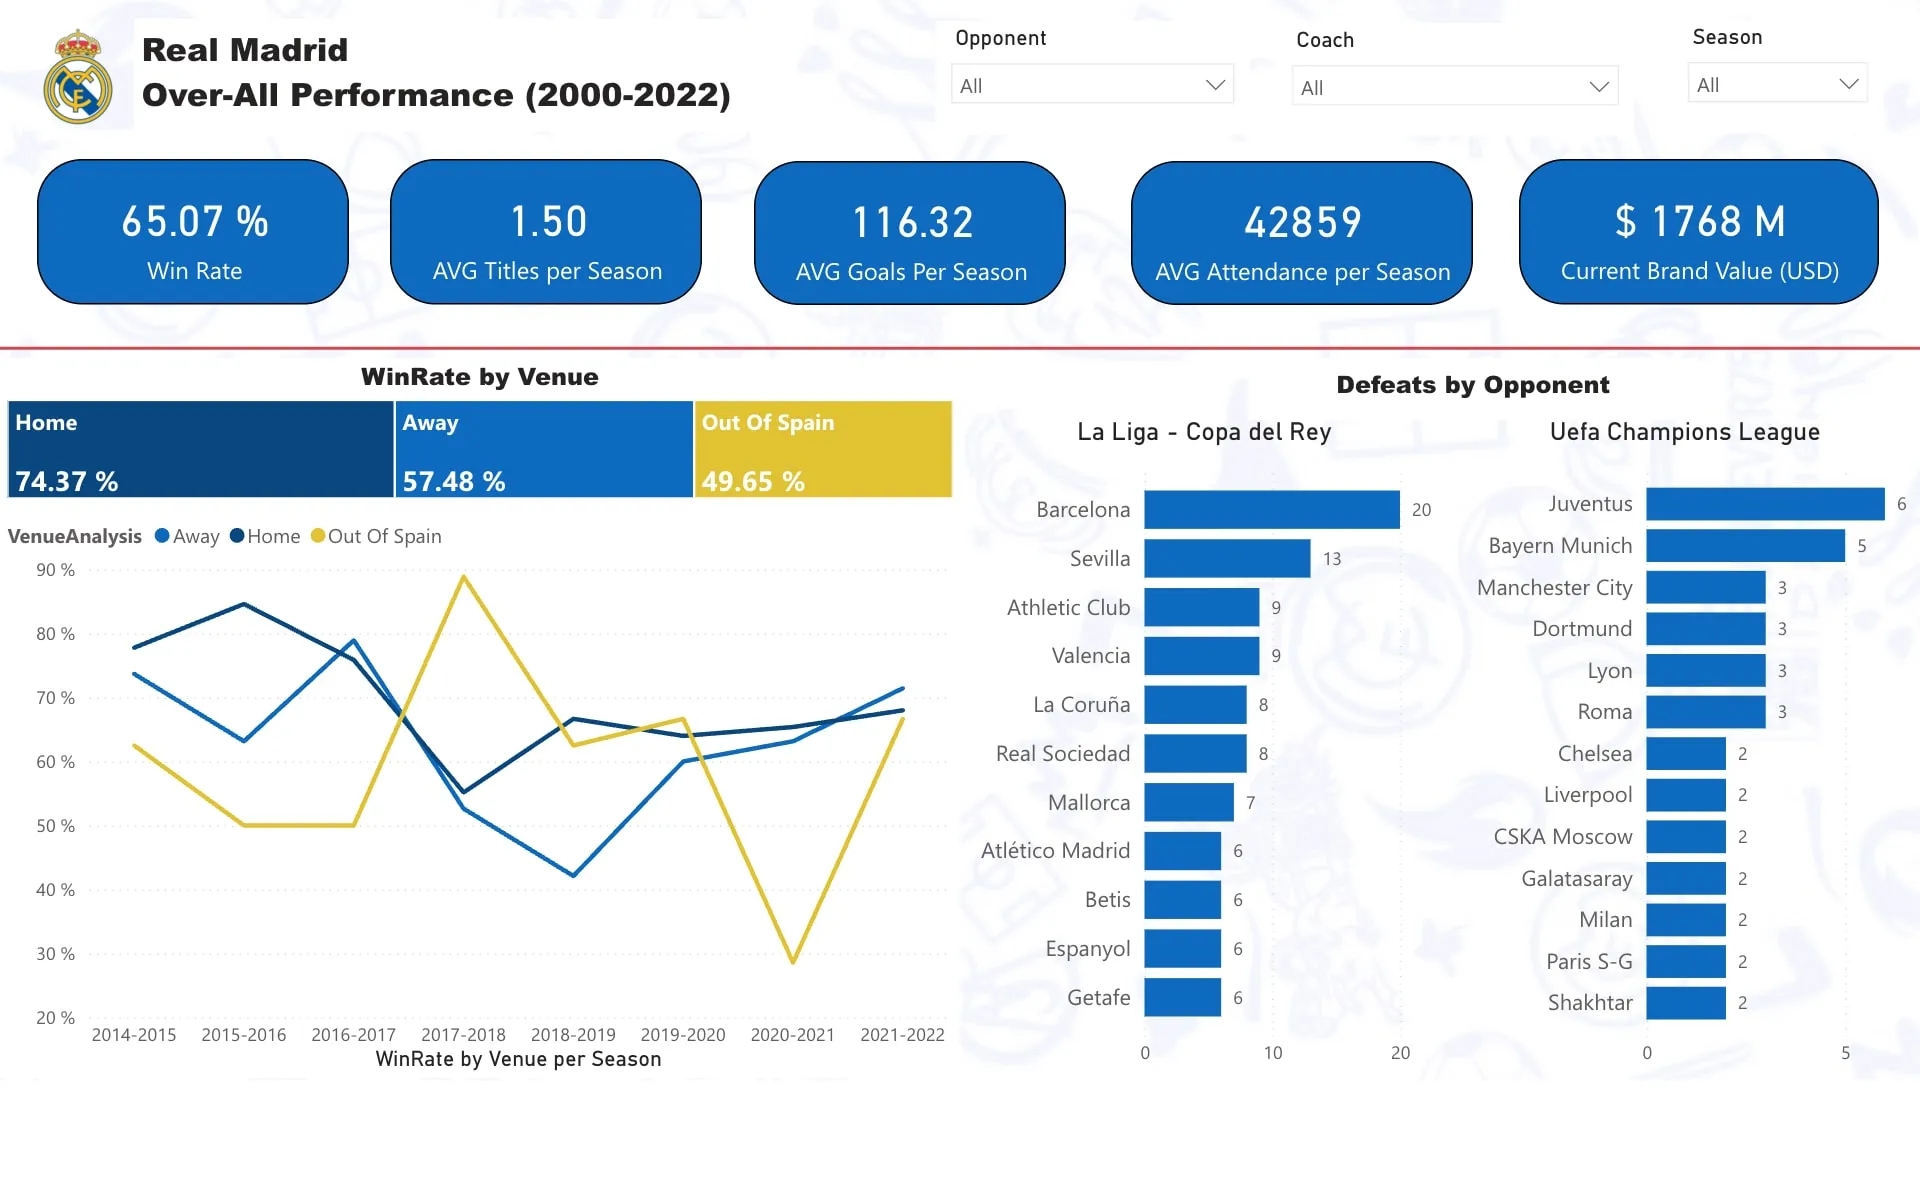
Over-All Performance. The wide shot: win/loss ratio, titles per season and goal evolution. This is the entry view, the one that sets context before drilling down.
Ramos Mastery. Defensive statistics for the captain. A centre-back is measured by different metrics than a striker, and the view is built around that difference.
CR7 Beyond the Field. Cristiano Ronaldo’s records during his time at the club, set against the team’s performance across those same years.
Champions League Legacy. The last ten years of European competition, and the metric that best captures the club’s identity.
How it’s built
The model follows a star schema with per-match fact tables and season, player and competition dimensions. DAX measures are written to be reused across views: the same win-ratio calculation works filtered by season, by competition or by player without duplicating logic.
The most important design decision was splitting the report into four views instead of stacking everything into one. Each answers a specific question, and that’s what makes the dashboard actually get used rather than looked at once.
Built in collaboration with Kendall González Solano.